Profiling and Debugging
This page discusses profiling tools (to ensure your code is running optimally) and debugging tools (to find errors in your code).
Python Profiling with line profiler
The starting point for profiling a Python code that uses a GPU (this includes PyTorch and TensorFlow) is to use line_profiler.
Install line profiler
pip install line-profiler
Nvidia diagnostic commands
The most used command to check Nvidia GPU status is nvidia-smi, which provides basic information about GPU usage on a node. This shows what GPU resources the job is currently using, helping a user to optimize what resources to request.
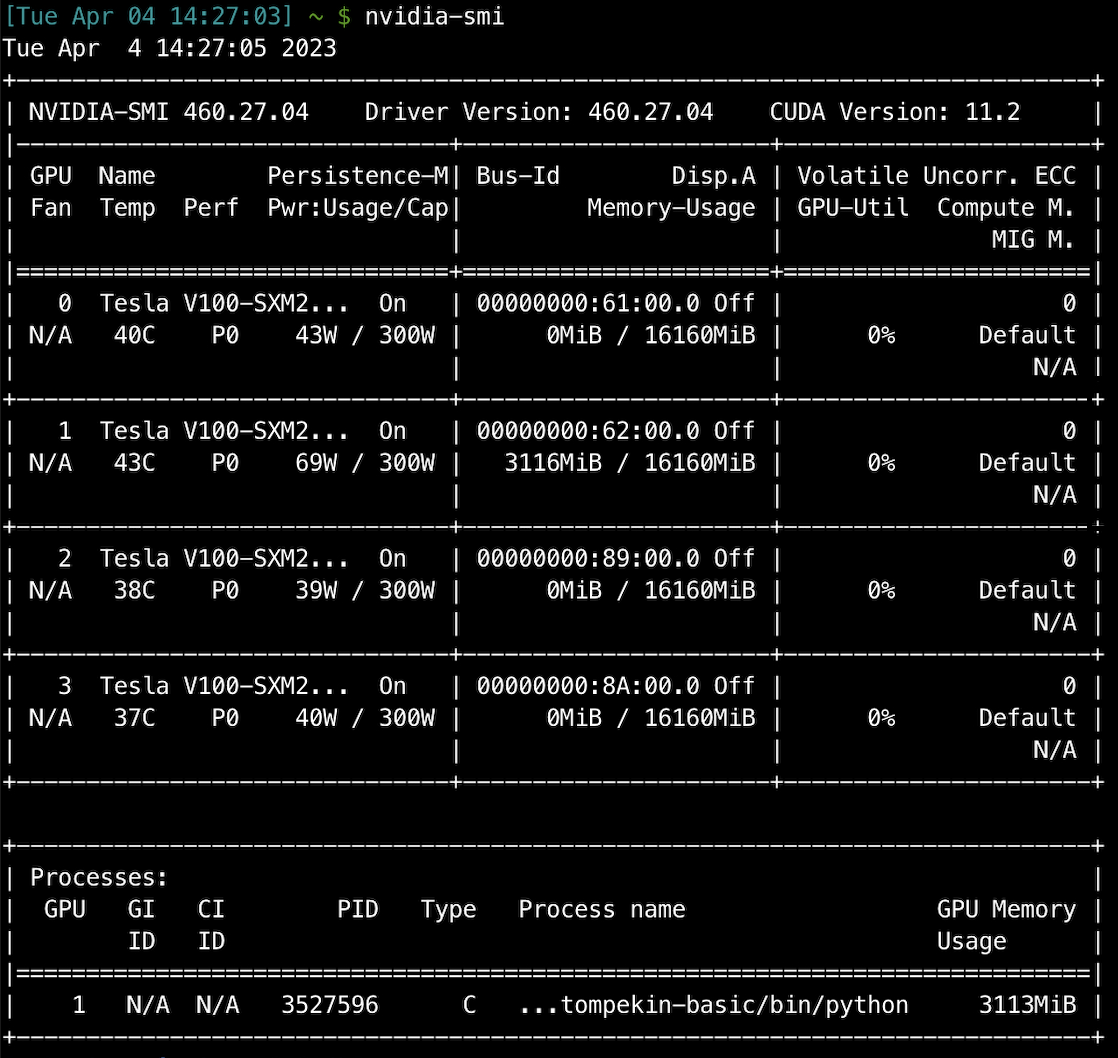
Running nvidia-smi with no arguments will provide a quick overview of current GPU status on the node the command is executed on, and only showing the GPUs allocated via SLURM. The response may look like this:

From this output, we know that this process on this machine has access to four Nvidia V100 GPUs, numbered 0 to 3, and there is a process running on GPU 1. Running nvidia-smi -i 0 would show the same view, but only for GPU 0.
- In this case, the job is only currently using 1 of the 4 requested GPUs, although it may have used more earlier. It is wise to only request resources you need, and
nvidia-smican help understand what resources your job is currently using.
More advanced information is returned using nvidia-smi -q, which returns a list of properties line-by-line, suitable for grep, etc., and nvidia-smi -q -i 0 would return the same list of properties for GPU 0 only.
The use of the real-time monitoring options for nvidia-smi is possible, but discouraged. Should you need to use them, remember to use relatively long polling times (e.g. 1-3 minutes) to avoid log spam.
nvidia-smi -h will yield a complete list of nvidia-smi options.
Remember that nvidia-smi only knows about GPUs connected to the CPU evaluating the command and allocated using SLURM.
Dlprof by Nvidia
If you are using PyTorch or TensorFlow on A100 GPUs then consider profiling your code with dlprof by NVIDIA. dlprof provides suggestions on how to improve performance.
Nsight by Nvidia
NVIDIA provides Nsight Systems for profiling GPU codes. It produces a timeline and can handle MPI but produces a different set of profiling data for each MPI process.
To look closely at the behavior of specific GPU kernels, NVIDIA provides Nsight Compute.